

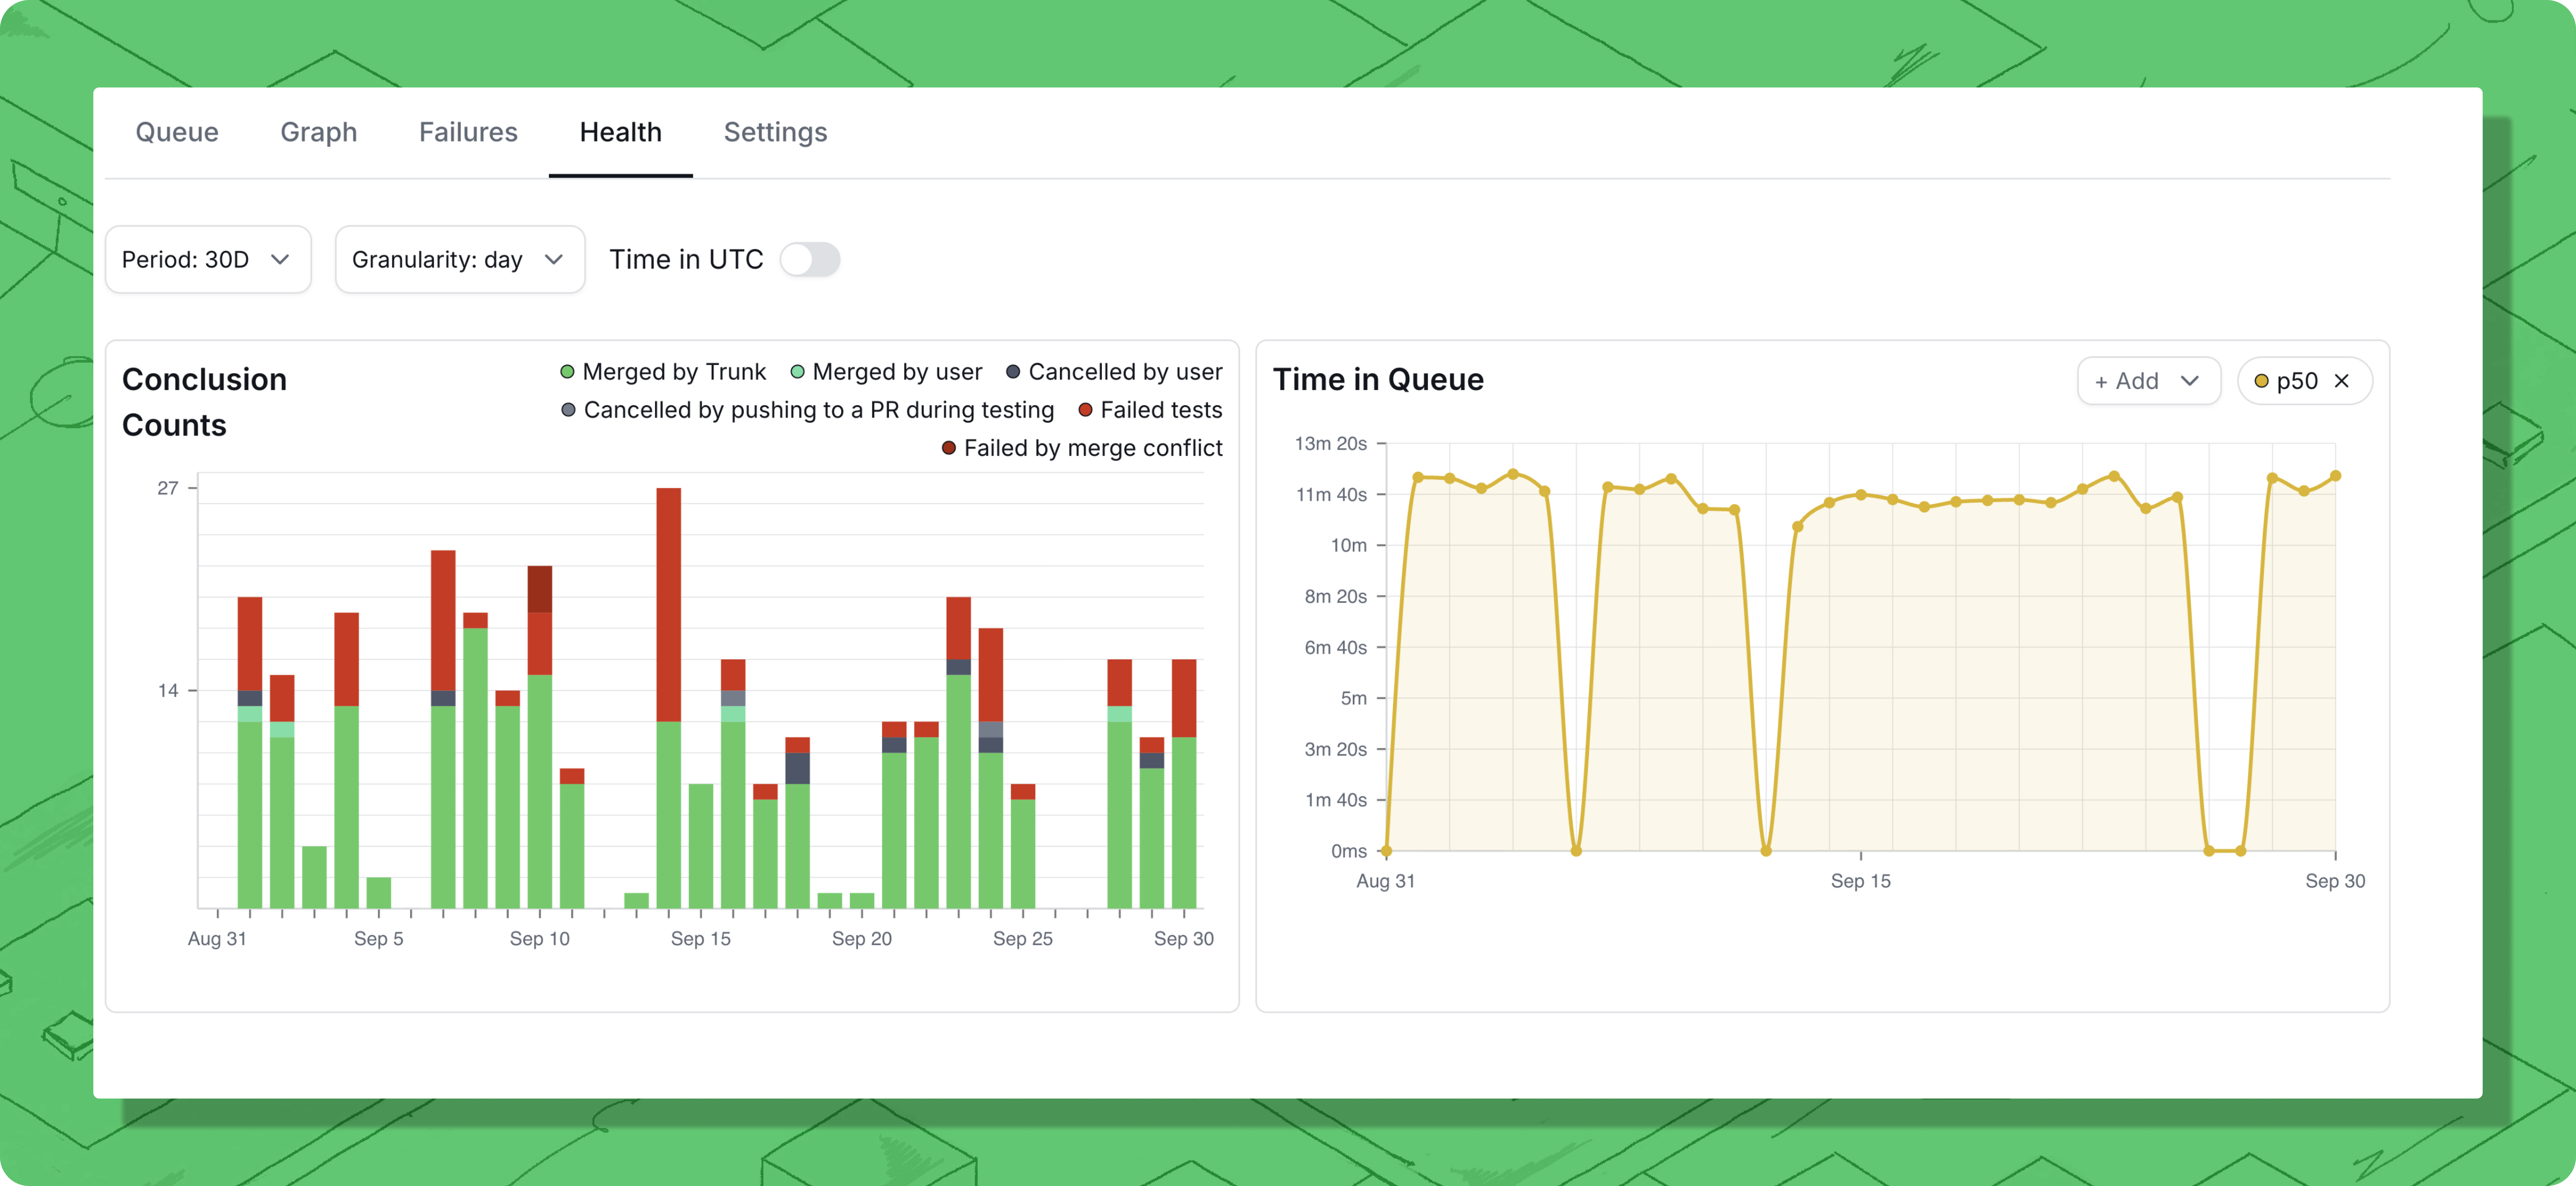
The Health tab showing metrics in the Trunk Web App.
Access metrics
You can access the metrics in your Trunk Merge Queue by navigating to the Merge Queue → [repository] → Health tab.CI Time and CI Jobs Triggered charts are only available for GitHub Actions.
Filter Metrics by Impacted Targets
When running in Parallel Mode, you can filter your merge queue health metrics by impacted targets to analyze performance for specific parts of your codebase.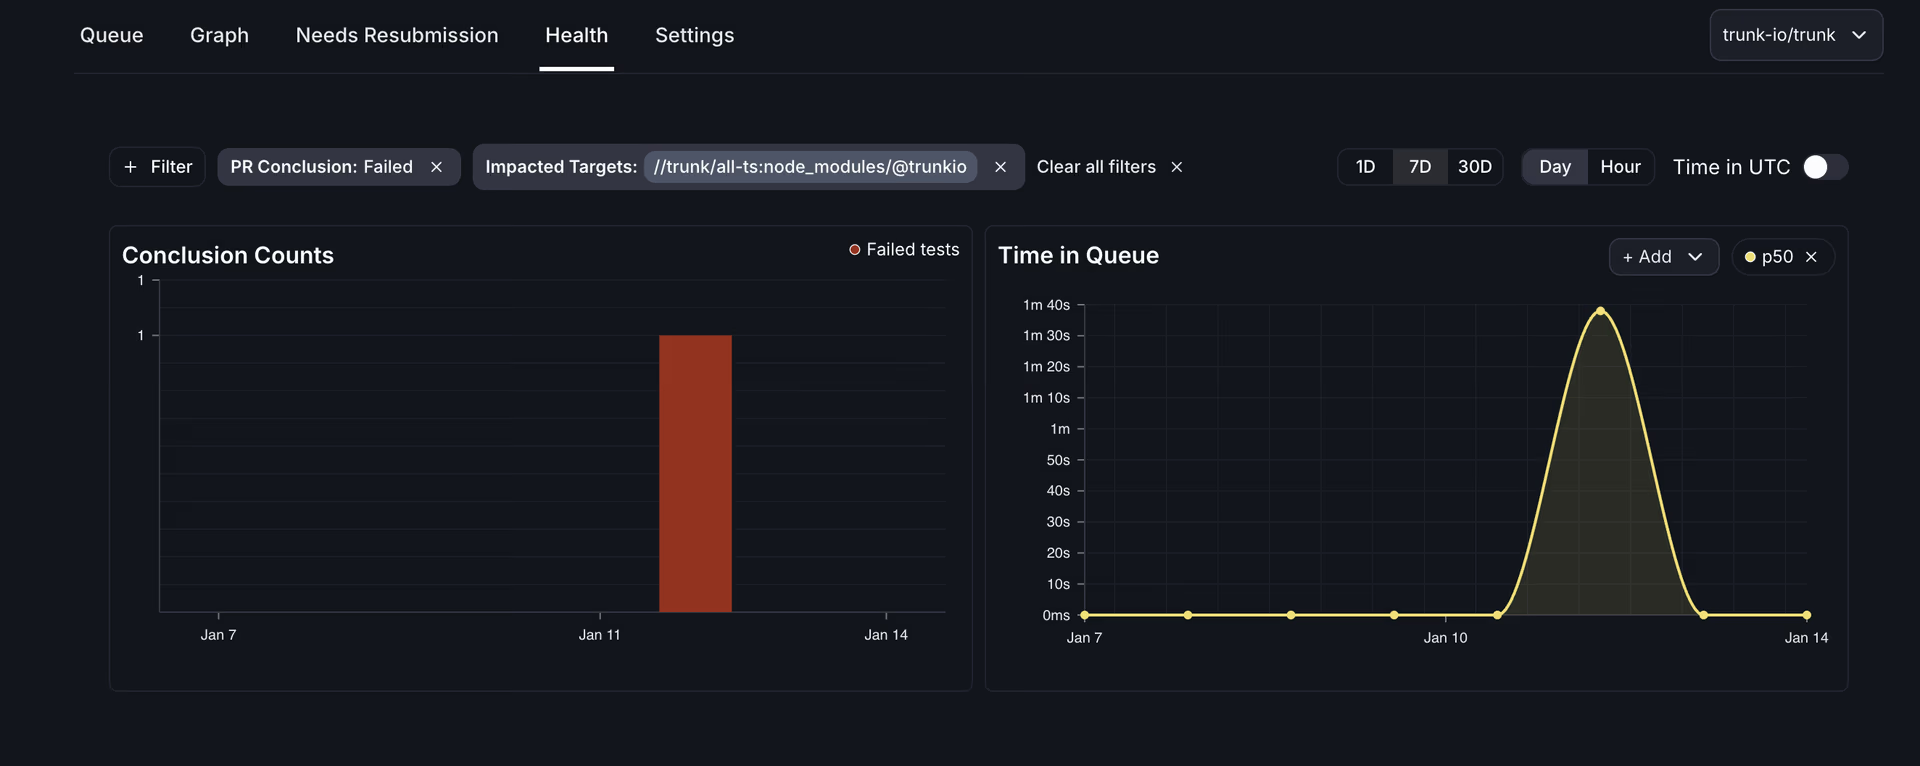
Why Filter by Impacted Targets?
In repositories with multiple teams or distinct components (like a TypeScript/Python monorepo), different parts of your codebase may have different merge characteristics. Filtering by impacted targets helps you:- Analyze team-specific performance - See how PRs from different teams move through the queue
- Identify bottlenecks by component - Determine if certain targets have slower merge times
- Optimize strategically - Focus queue configuration improvements on your highest-priority code paths
- Demonstrate value - Show engineering leadership how parallel mode benefits specific teams or projects
- Check fairness - Verify that all teams experience similar queue performance
How to Use the Filter
- Navigate to Merge Queue → [your repository] → Health tab in the Trunk web app
- Locate the Impacted Targets filter dropdown at the top of the metrics dashboard
- Select one or more targets to filter by:
- All Targets (default) - Shows aggregate metrics across all PRs
- Specific target names - Shows metrics only for PRs affecting that target (e.g.,
frontend,backend,//services/api)
- All charts and metrics on the page will update to reflect only PRs impacting the selected targets
Understanding the Data
Impacted targets are set when a PR enters the queue. Each PR’s impacted targets are calculated based on which files changed and which parts of your codebase are affected. For details on how impacted targets are computed, see Parallel Queues - Impacted Targets. PRs can affect multiple targets. A PR that changes both frontend and backend code will be counted in metrics when filtering by eitherfrontend OR backend. This means the numbers may not sum to 100% when viewing multiple target filters separately.
“All Targets” shows aggregate performance. Selecting “All Targets” displays metrics for every PR, regardless of which targets it impacts. This is the default view and shows overall queue health.
Requirements
Parallel Mode must be enabled. Impacted target filtering is only available when your merge queue is running in Parallel Mode. Repositories in Single Mode do not track impacted targets. Impacted targets must be uploaded. Your CI workflow must calculate and upload impacted targets for each PR. See the Parallel Queues documentation for setup instructions using:- Bazel
- Nx
- Custom build systems
Export metrics as CSV
Each chart on the Health dashboard has a download icon in its top-right corner. Clicking it exports the chart’s current data as a CSV file, using the same filters and time range shown on screen. Exported filenames follow the pattern<chart>-<branch>-<start>_<end>.csv. Timestamps match the chart’s UTC setting: when Time in UTC is on, timestamps are in UTC; otherwise they use your local timezone. The download button is greyed out when the current filters return no data.
Time buckets
The date ranges selector at the top left of the dashboard allows you to filter the data displayed by date and time. You can display time buckets by the day or hour in the day/hour dropdown. The metrics displayed only include data that have completed within the time range, jobs started but not completed during the selected time will not be displayed.Conclusion count
Conclusion count displays the number of pull requests that exited the merge queue during each time bucket. This includes passes, failures, and cancellations. Passes and failures signal a PR that was tested in the queue to completion, while canceled signals that the request to merge terminated before testing finished or before testing began. Conclusion counts are an important signal to potential bottlenecks or underlying issues with your merging process, as a failure or cancellation in the merge queue can force other PRs to restart their testing. A spike in the number of failures or passes can indicate a potential problem to investigate. Conclusions are tagged with a reason to give further insights into how merges pass or fail in the queue. You can show or hide conclusions of a particular reason by using the + Add button.Time in queue
Time in queue shows how long each PR spends in the Merge Queue from the moment the PR enters the queue to the moment when it exits the queue, either from merging, failing, or being canceled. Understanding the amount of time a pull request spends in the queue is important for ensuring your merge process continues to ship code quickly. A spike in the time to merge indicates a slowdown somewhere that’s impacting all developers. For example, it’s taking longer to run tests on PRs, PRs are waiting too long to start testing, or constant failures in the queue are causing PRs to take longer to merge The time in queue can be displayed as different statistical measures. You can show or hide them by using the + Add button.Drill down into metrics
From the Conclusion count and Time in queue charts, you can drill into any point or window on the graph to see the exact pull requests that made up those numbers.Why Drill Down?
Aggregated charts tell you that something happened — drilling down tells you which PRs caused it. This makes it easy to:- Track down outliers — if the P99 on Time in queue spikes, drill into that bucket to find the specific PR that dragged the tail out.
- Investigate failure spikes — click a bar on Conclusion count where failures jumped and see exactly which PRs failed and why.
- Audit a time window — pull the full list of PRs merged, failed, or canceled during an incident window or release cut.
- Answer one-off questions — “which PRs merged between 2pm and 4pm yesterday?” without writing a query against the Prometheus endpoint.
Select Data Points
You have two ways to select:- Click a single data point to see the PRs in that time bucket.
- Click and drag across the chart to select a range of data points spanning multiple time buckets. The selected range stays highlighted and the rest of the chart dims, giving you a focused view of just that window. The same range syncs across both charts so you can correlate Conclusion count and Time in queue data for the period you picked.
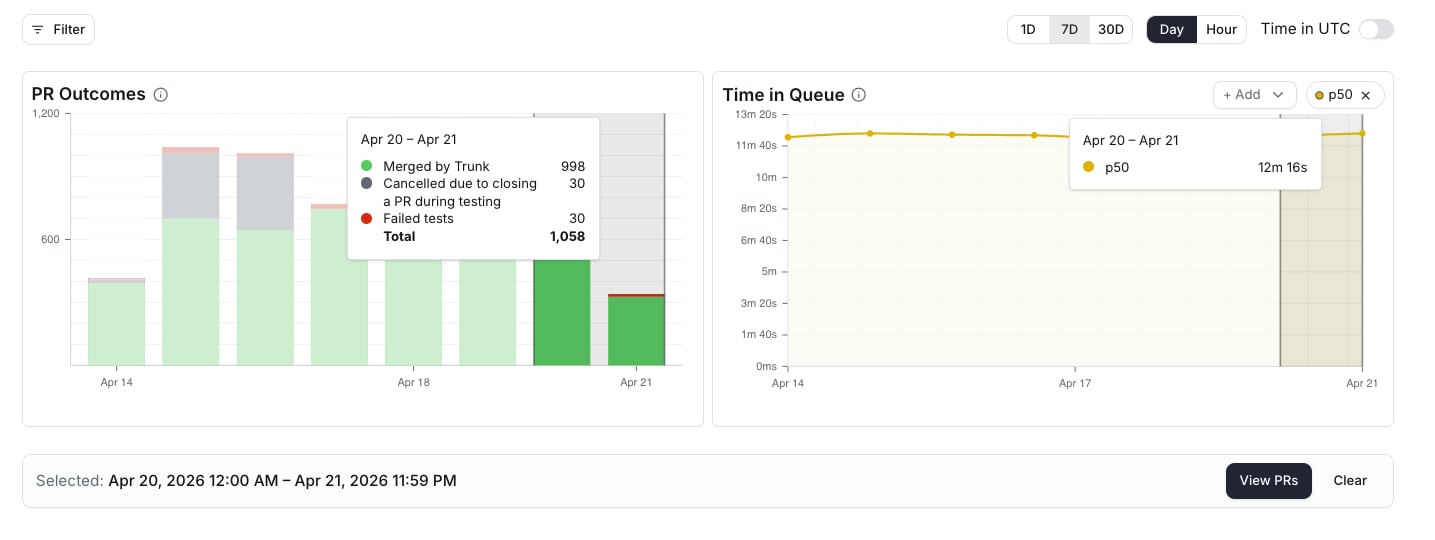
The View PRs button appears after selecting a data point or range.
Review the PR List
The PR list page shows every PR included in your selection, along with:- Conclusion — whether the PR merged, failed, or was cancelled.
- Reason — the specific cause behind the conclusion (for example, Merged by Trunk, Required status failed, PR closed). See the Conclusion count table for the full list.
- Time in queue — how long the PR spent in the merge queue from entry to exit.
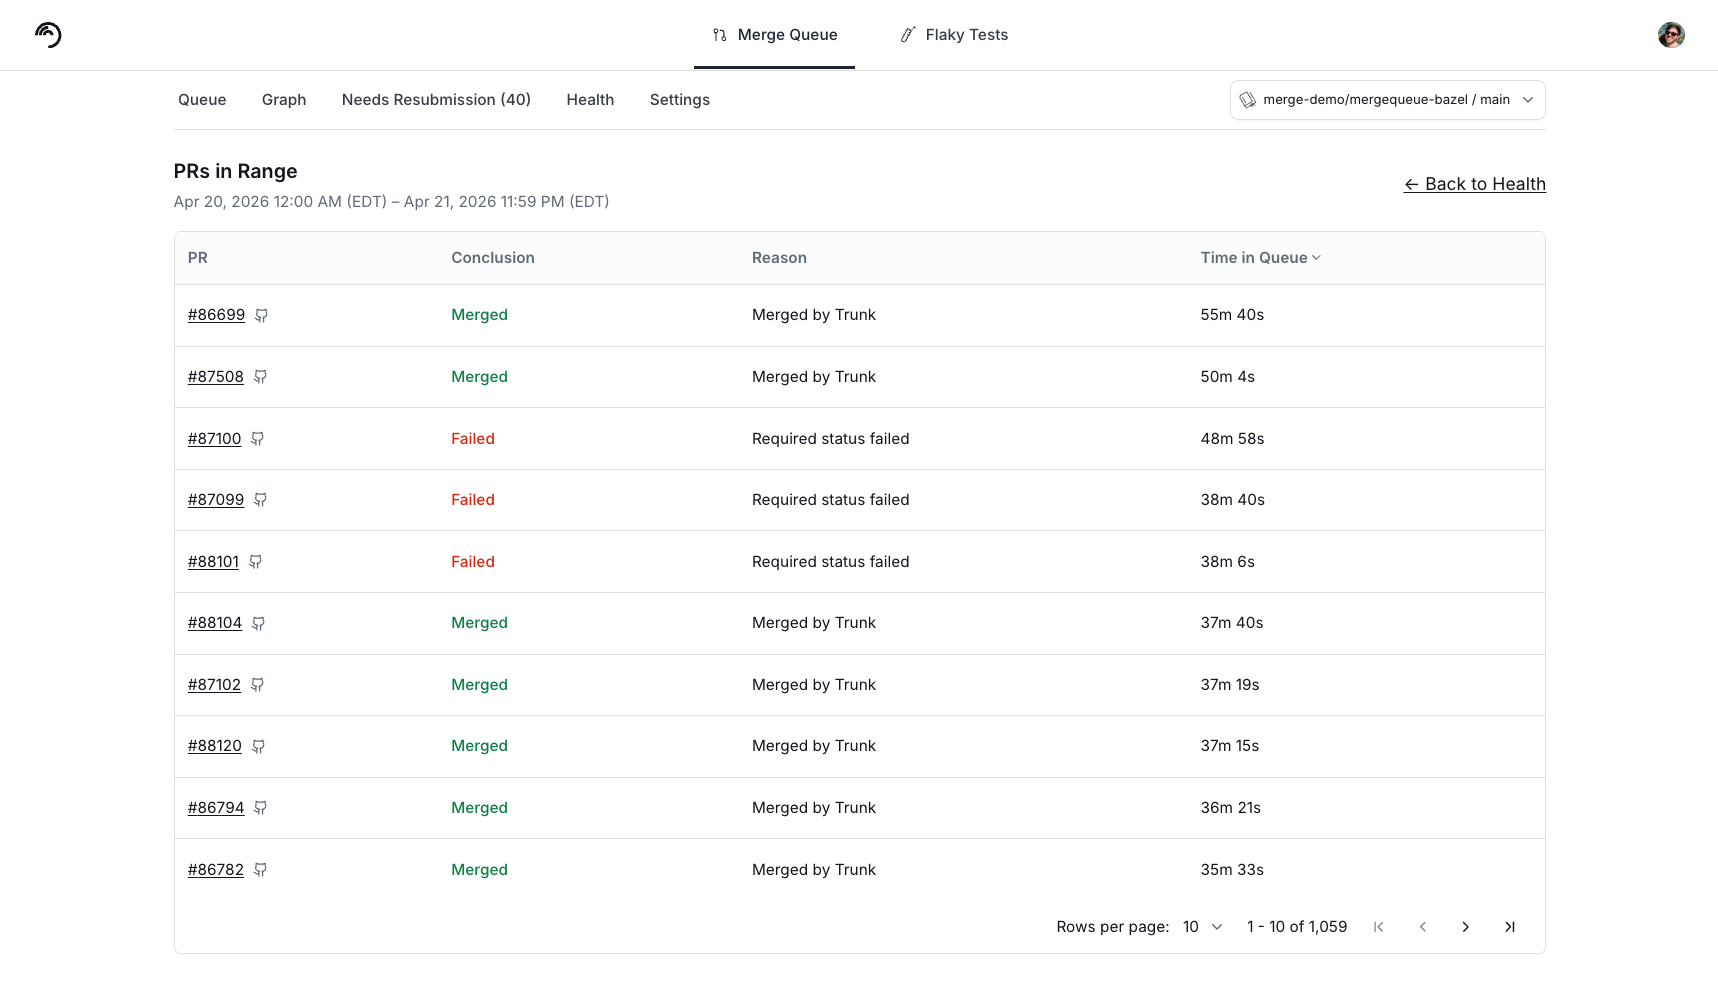
The drill-down PR list, sortable by conclusion and time in queue.
Drill down and range selection are currently available on the Conclusion count and Time in queue charts. Additional Health charts will support the same interactions as they land in the UI.
Prometheus metrics endpoint
Trunk exposes merge queue metrics in Prometheus text exposition format via a scrapable API endpoint. Use this to build custom Grafana dashboards, set up alerts, or integrate merge queue health into your existing observability stack.The Prometheus metrics endpoint is available to all Merge Queue users.
Endpoint
x-api-token header.
Query parameters:
The response uses content type
text/plain; version=0.0.4; charset=utf-8 (standard Prometheus format).
Available metrics
All metrics include these labels:
Point-in-time gauges reflect the current state of your merge queue.
Rolling 1-hour window metrics summarize activity over a sliding 1-hour window. They update continuously as the window advances.
Each histogram emits
_bucket{le="..."}, _sum, and _count series. Bucket boundaries (in seconds): 60, 300, 600, 900, 1800, 3600, 5400, 7200, +Inf.
For clarity, PRs in the “Waiting to Enter Queue” state (submitted to the queue but still waiting on prerequisites such as GitHub mergeability before they can be admitted to the queue) are not considered to be “in the queue” yet. So any time spent in this state is not counted in the Wait Duration or Time in Queue metrics.
Rolling window metrics use gauge semantics, not true Prometheus counters. They represent a snapshot of the last hour, not cumulative totals. PromQL functions like
rate() and increase() are not meaningful on these metrics. Use the values directly instead.Scrape configuration
Configure your Prometheus instance to scrape the Trunk metrics endpoint:repo and repoHost parameters.
Datadog Agent configuration
You can ingest Trunk merge queue metrics into Datadog using the Datadog Agent’s built-in OpenMetrics integration. This lets Datadog scrape the Prometheus endpoint directly without requiring a separate Prometheus server. 1. Enable the OpenMetrics integration Create or edit/etc/datadog-agent/conf.d/openmetrics.d/conf.yaml:
All metrics are prefixed with your configured
namespace value. For example, mq_depth_current becomes trunk_merge_queue.mq_depth_current in Datadog.